

Tom Willis is an award-winning marketing leader and Co-founder of Lawpath. Tom’s journey journey includes steering several entrepreneurial projects and addressing the unique challenges faced by small businesses. As the Chief Marketing Officer at Lawpath, Tom has been pivotal in shaping the company’s marketing strategy and business growth.
After two months of stronger-than-expected growth, you’d expect things to cool off. A reset. Maybe even a dip.
That didn’t happen.
Registrations climbed again. Company formations hit a new high for the year. One state posted its strongest result in recent index history. And one industry grew fast enough to reset expectations of what “peak growth” even looks like.
At first glance, that’s surprising.
Through February and into March, conditions didn’t get easier. Fuel prices pushed higher. Interest rates held firm. Cost pressure stuck around.
And yet, more people started anyway.
The March 2026 Lawpath Business Index combines verified data from the Australian Business Register and ASIC with anonymised insights from thousands of businesses starting through Lawpath. It shows what people are actually doing, not what they say they might do.
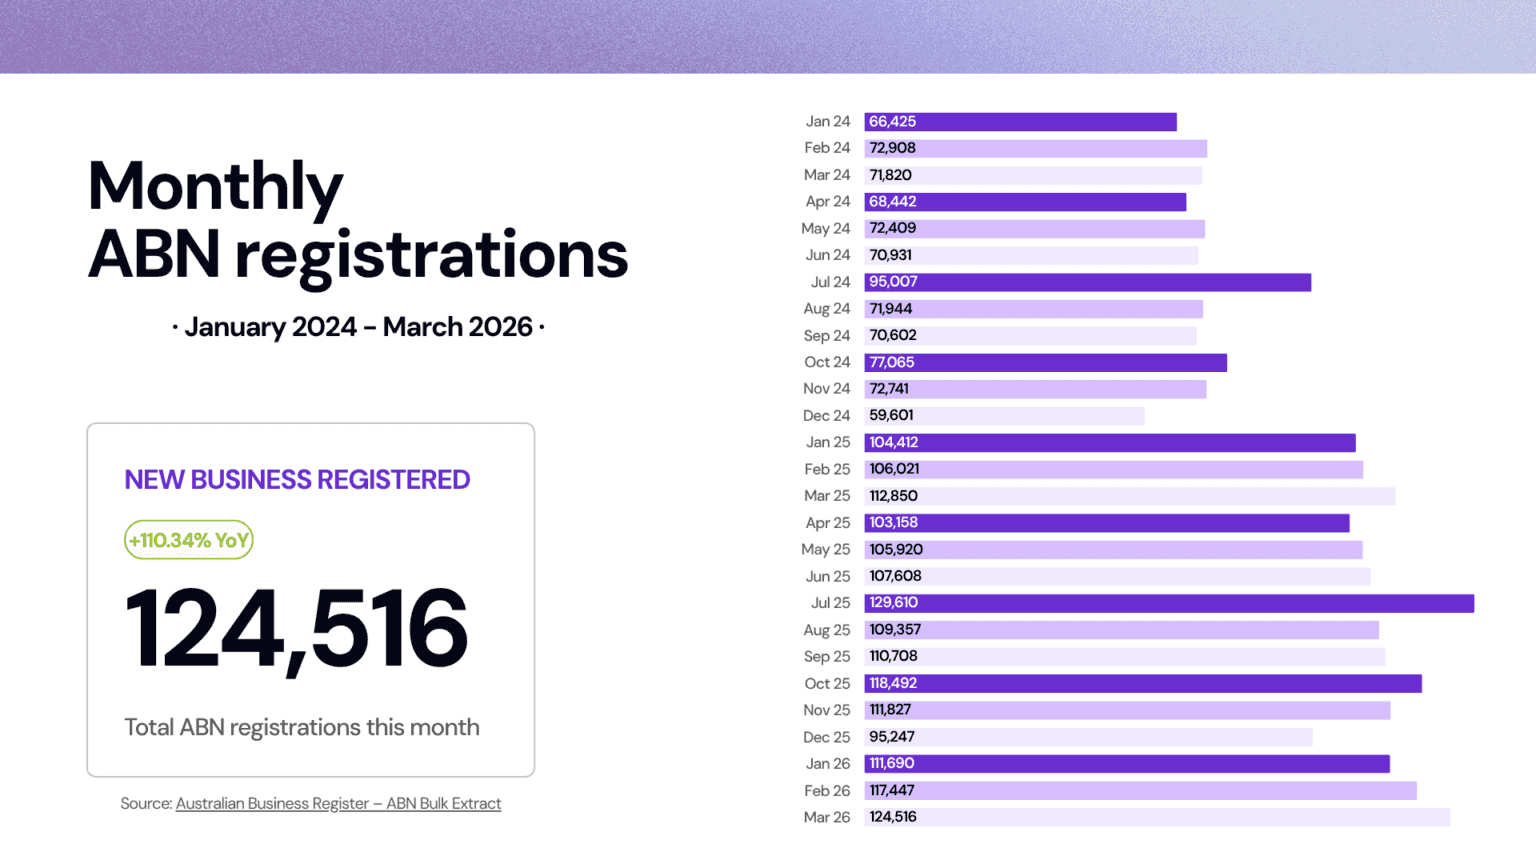
Monthly ABN Registrations
March 2026 recorded 124,516 ABN registrations, a 10.34% increase year on year from 112,850 in March 2025. That rate of growth is broadly consistent with the first quarter’s pattern – January came in at 6.97% year on year and February at 10.78% – pointing to a market that has settled into a steady elevated tempo rather than spiking and retreating.
To put the raw volume in context: across 31 days, Australia was registering more than 4,016 new businesses every single day in March. That is not a market running warm at the edges. More telling still is the sequential trend. January’s 111,690. February’s 117,447. March’s 124,516. Three consecutive months of growth, each higher than the last. That kind of compounding momentum across the opening quarter of a calendar year has not been a feature of recent index data. It points to a cohort of founders who did not rush in at the start of the year and then fade – they kept moving.
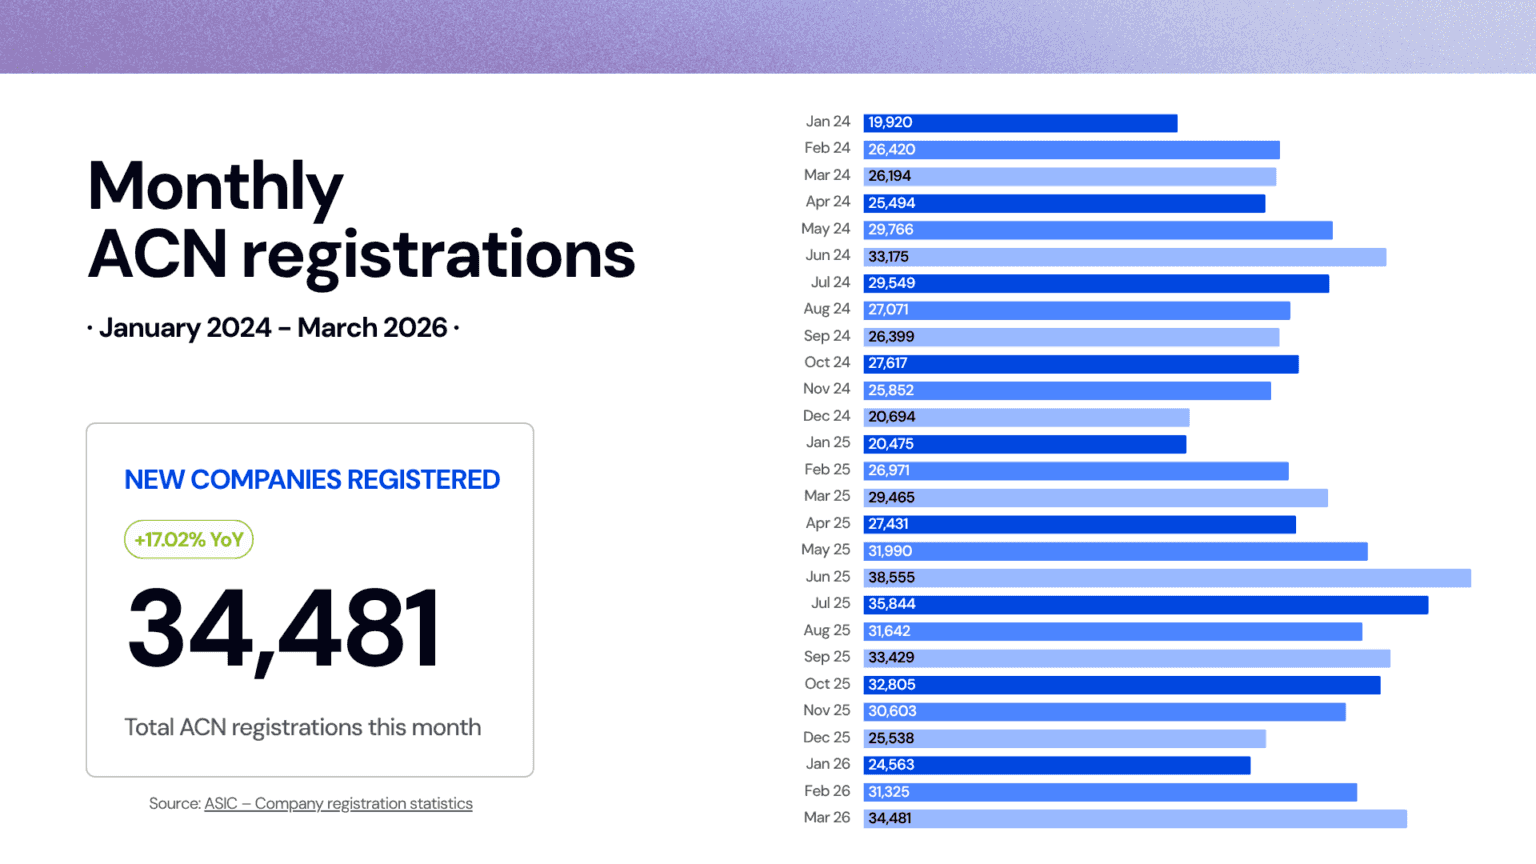
Monthly ACN Registrations
34,481 new companies were registered in March, up 17.02% year on year from 29,465 in March 2025, and the highest monthly ACN figure recorded in the index this year.
Company formations have now outpaced the broader ABN growth rate for three consecutive months. That consistency is the signal worth watching. It is not a coincidence of timing or a structural quirk. It reflects a deliberate pattern: founders in 2026 are increasingly choosing to incorporate at the point of market entry, rather than starting informally and restructuring later. The pipeline of commercially active, formally structured businesses entering the market is deeper than at any comparable point in recent memory.
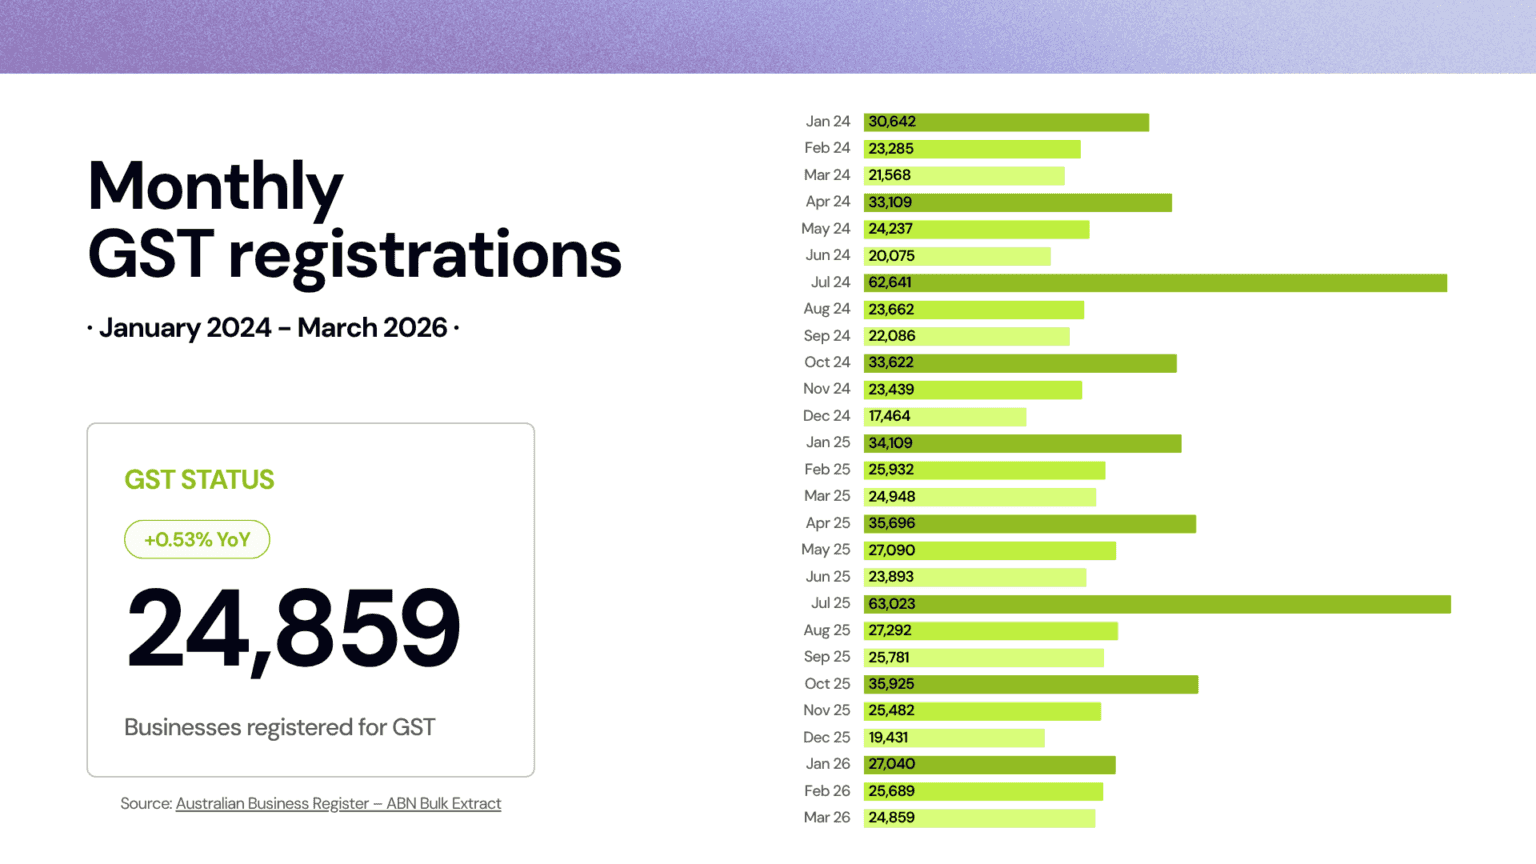
Monthly GST Registrations
24,859 businesses registered for GST in March, up a marginal +0.53% year on year from 24,948 in March 2025.
After January’s steep GST decline and February’s near-flat result, March confirms the stabilisation. The gap between ABN volume and GST registrations remains significant – many new operators are still trading below the $75,000 threshold or choosing to delay registration – but the pattern of the last two months suggests the January drop was an anomaly, not a direction. A market producing 124,516 ABNs in a single month while holding GST registrations roughly flat is a market with a large number of early-stage ventures still building toward revenue activation. That gap tends to close over time as businesses trade into maturity.
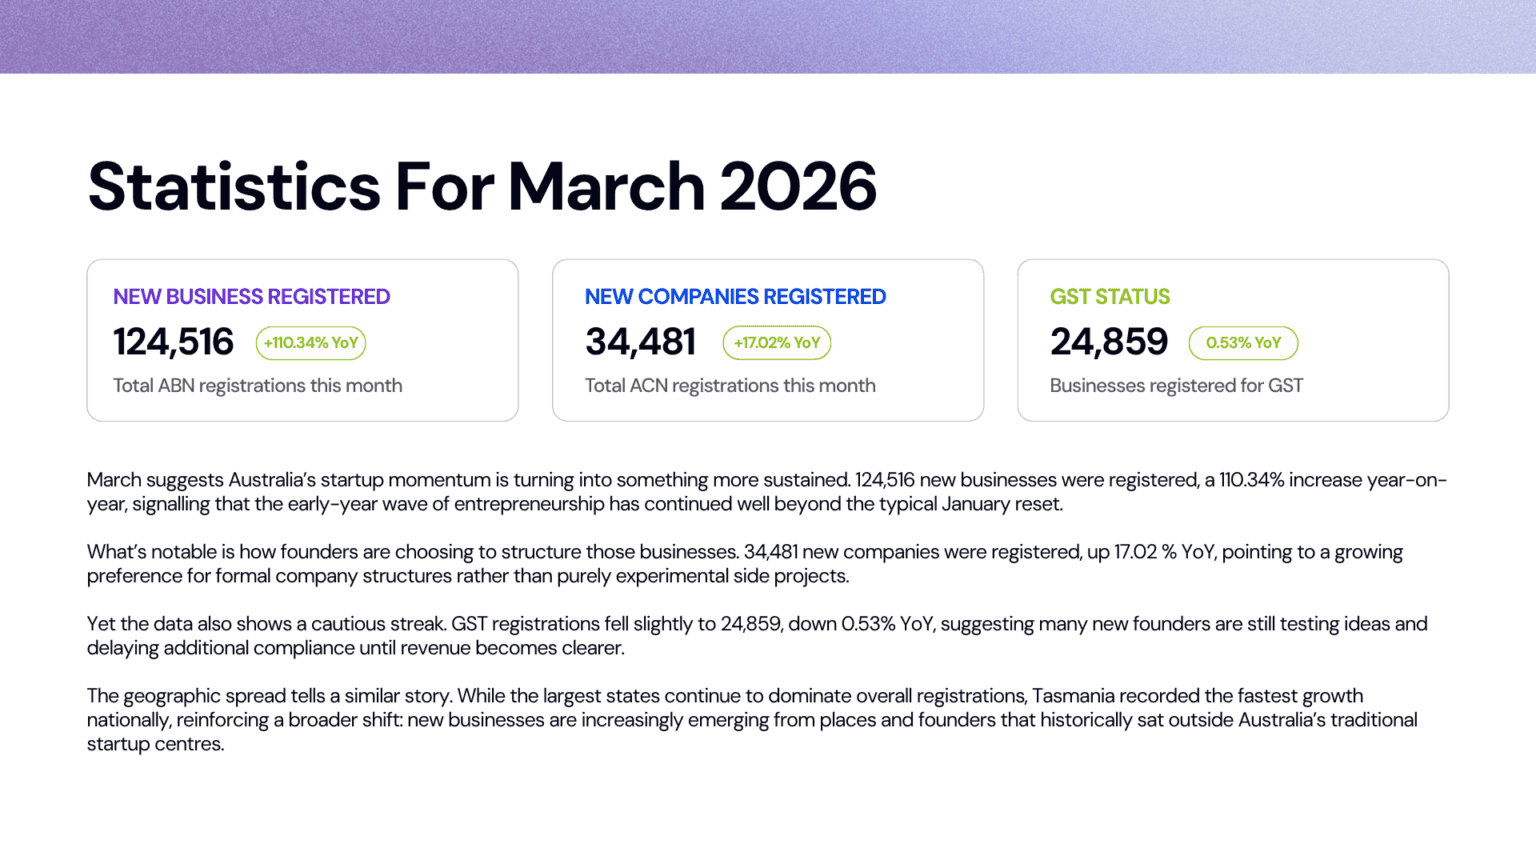
Statistics for March 2026
March’s three headline figures are the clearest picture the index has produced so far in 2026.
ABN registrations at 124,516 represent the highest monthly total of the year, growing 10.34% year on year. ACN registrations at 34,481 grew 17.02% year on year and set a new monthly high for 2026. GST registrations at 24,859 held essentially flat against the prior year for the second month running.
What these figures describe, taken together, is a market where formation volume is high and rising, incorporation is the preferred structural choice of a growing share of new entrants, and revenue activation is following at a measured pace. The founders entering in March are not uniformly cautious or uniformly aggressive. They are a diverse cohort with a clear bias toward doing things properly from the start – which is exactly what the ACN trend reflects.
The gap between ABN growth (10.34%) and ACN growth (17.02%) is now a persistent feature of the 2026 data, not a monthly anomaly. Founders are not just arriving in greater numbers. A growing share of them are arriving with structure.
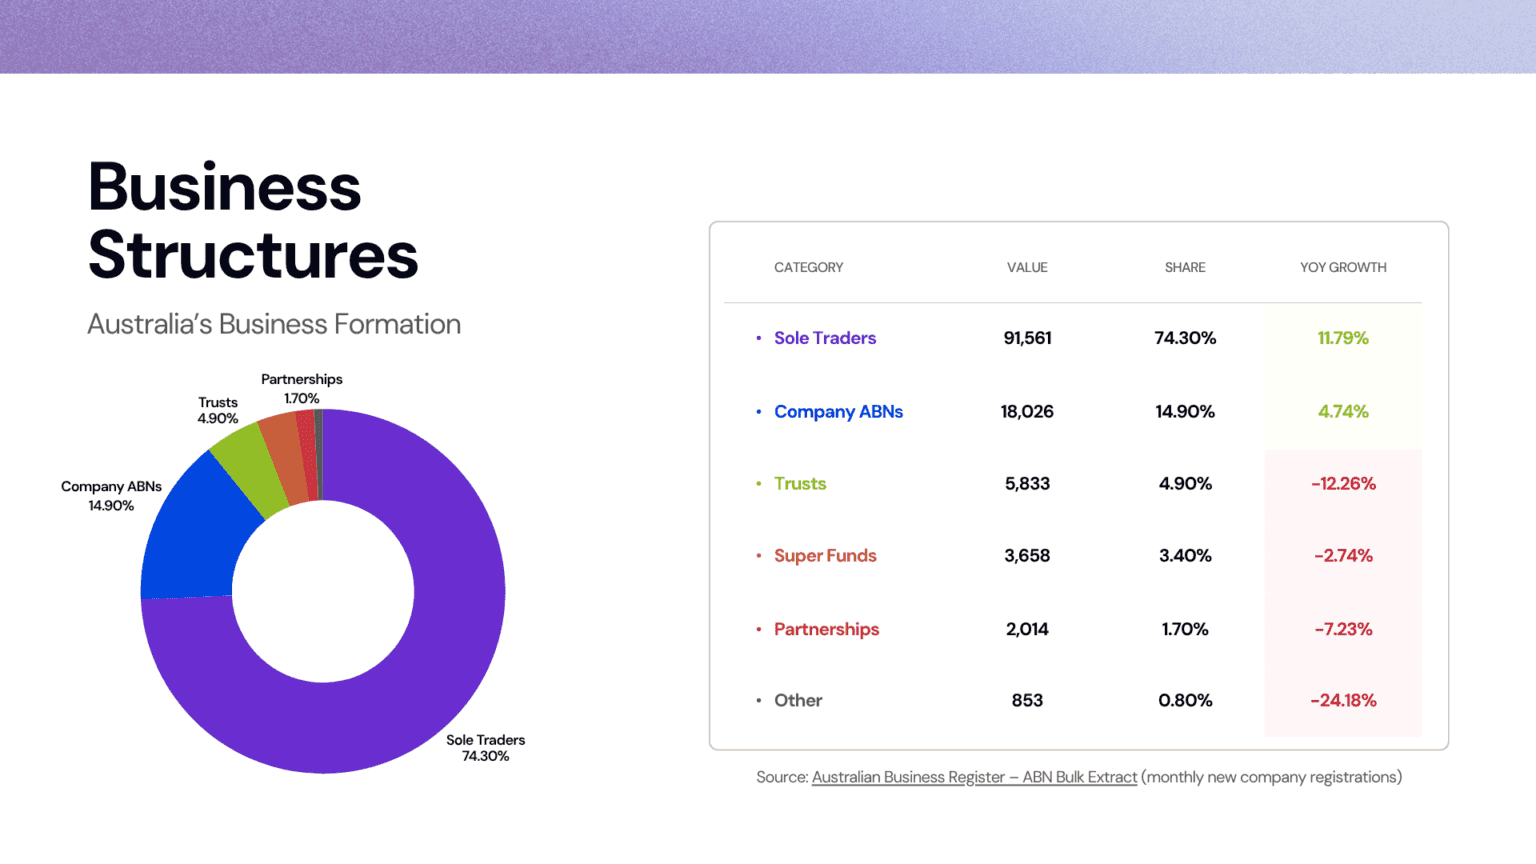
Business Structures
Sole traders remained the dominant structure by a wide margin, with 91,561 registrations representing 74.3% of all new ABNs and 11.79% year-on-year growth. The model’s appeal is unchanged: quick to establish, straightforward to run, and immediate in its ability to generate income. The acceleration in this segment across the first quarter suggests a large and growing number of Australians are formalising income activity they were already doing, rather than building toward something speculative.
The more important structural trend in March, however, is the continued strength of company formations. With 18,026 company ABNs growing at 4.74% year on year through the ABR, and ACN registrations at ASIC reaching 34,481 at 17.02% growth, the preference for incorporated structures is now well-established across the first quarter.
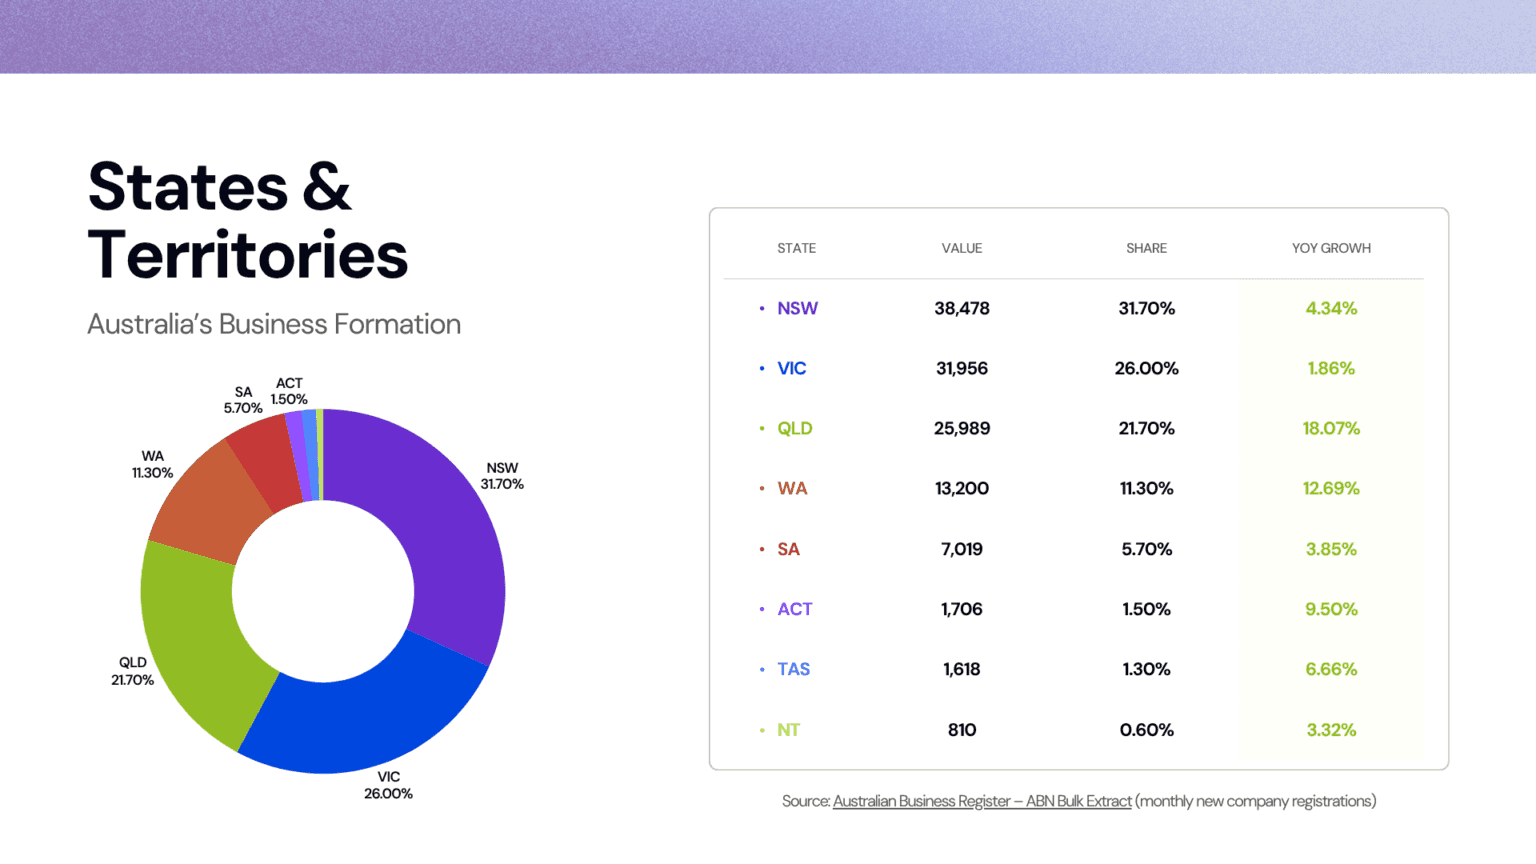
States and Territories
New South Wales, Victoria, and Queensland continue to account for the majority of formation volume, a function of population size and commercial infrastructure that is unlikely to shift in the near term.
Within that context, Queensland’s 18.07% year-on-year growth was the standout state result in March – the fastest rate of any major state in the index this month. That is a meaningful shift for a state that has been building commercial momentum steadily, and it reflects the broader demographic and economic changes underway across the southeast. Population growth, relative affordability compared to Sydney and Melbourne, and the continued maturation of Brisbane as a commercial centre are all contributing to an environment where entrepreneurship is finding strong conditions.
Western Australia at 12.69% and the ACT at 9.50% continued their consistent run, reinforcing the decentralisation pattern that has been a feature of the index throughout the first quarter. Business formation in 2026 is not concentrating further in Australia’s two largest cities. It is spreading.
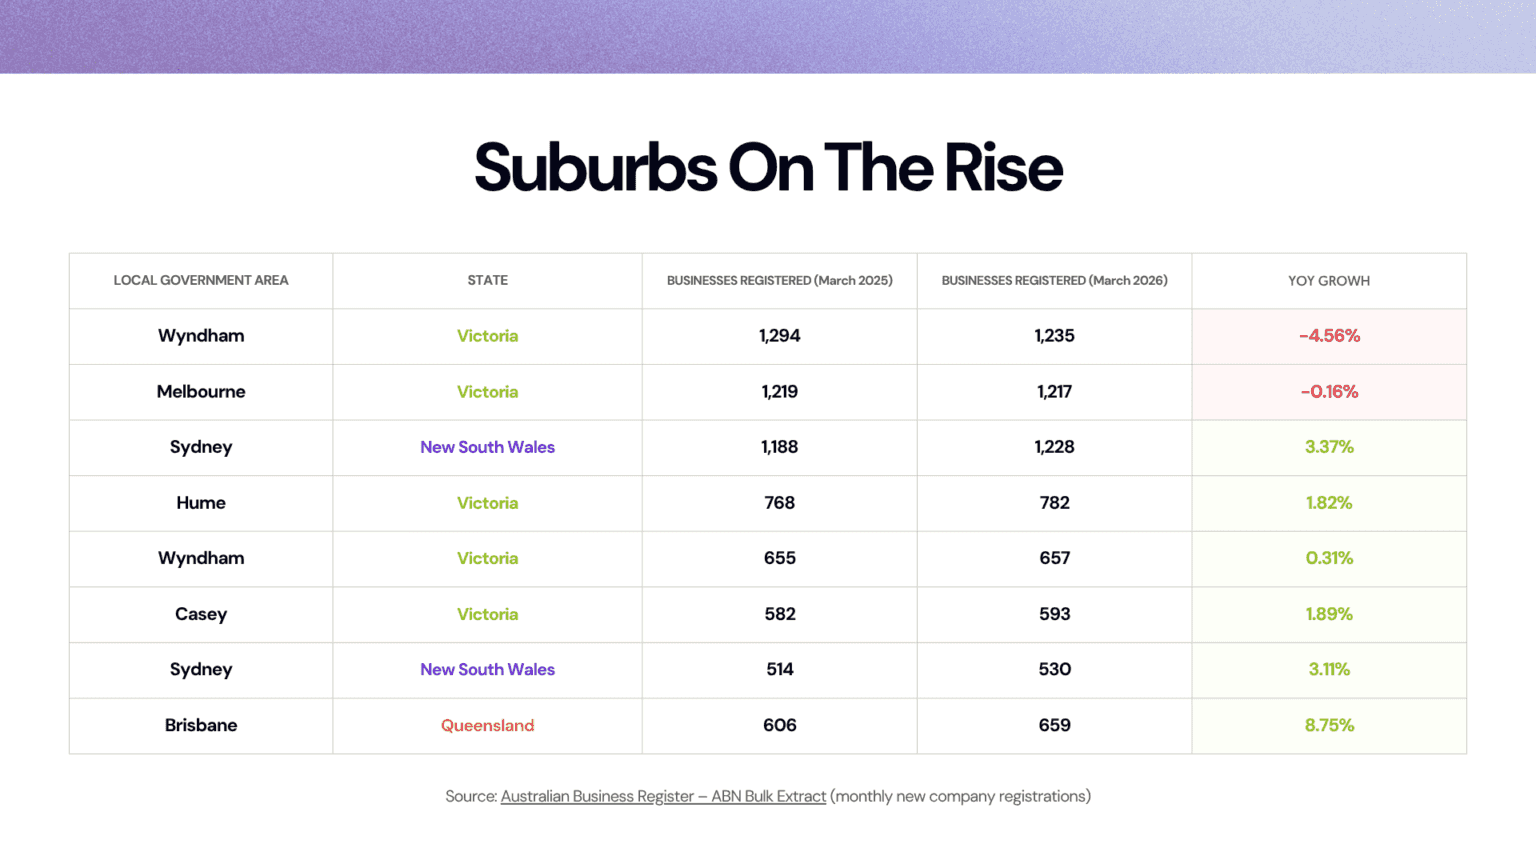
Top Suburbs by New Business Registrations
The top local government areas by registration volume in March are largely consistent with recent months. Wyndham in Victoria led with 1,235 registrations, Melbourne and Sydney recorded 1,217 and 1,228 respectively, and Brisbane came in at 659 – its strongest result in the current data set, up 8.75% year on year.
The persistence of outer-metro locations like Wyndham and Hume near the top of the volume rankings is the more instructive data point. These are not professional services hubs or startup precincts. They are communities where population growth has created commercial demand that the existing business ecosystem has not yet caught up with, and where new entrants are finding genuine gaps rather than crowded markets.
Suburbs Experiencing Rapid Growth
Brisbane’s 8.75% year-on-year growth in March was the strongest result of any major LGA in the index, consistent with Queensland’s state-level outperformance this month. Sydney posted growth across multiple LGAs, and Hume and Casey in Victoria continued their steady upward trajectory.
The broader pattern of percentage-based growth in March tracks suburban and outer-metro corridors – communities growing faster than their service infrastructure, where new businesses are entering markets that are expanding ahead of competition rather than fighting for share in established ones. For business owners considering where to grow, these are not speculative locations. They are markets where the customer base is arriving before the operators.
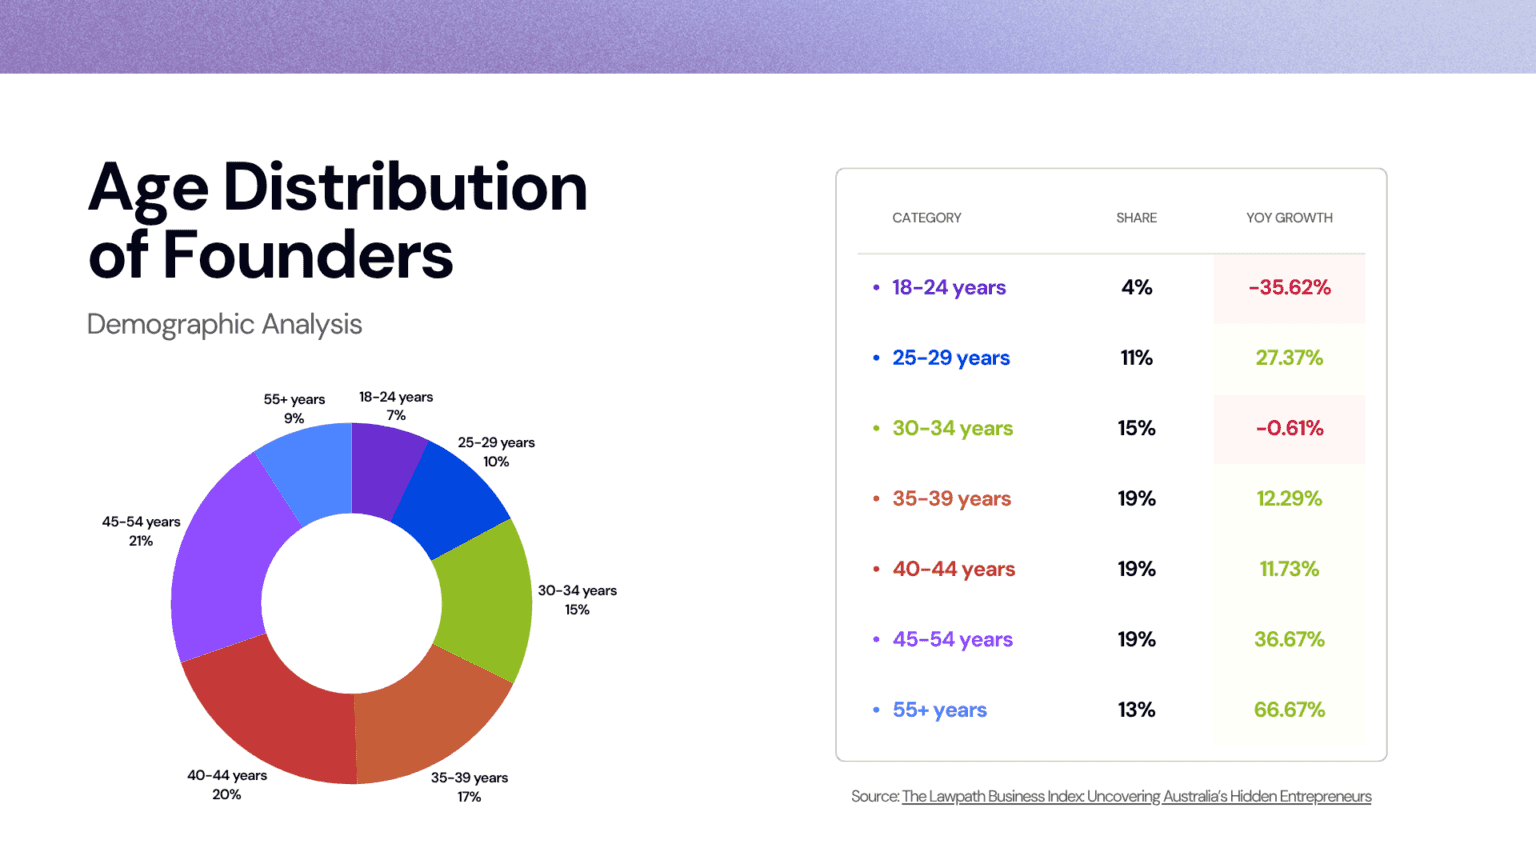
Age Distribution of Founders
The most striking demographic development in March is a shift that continues to intensify. Founders aged 55 and over recorded 66.67% year-on-year growth – the highest growth rate of any age group in the index – representing 13% of all registrations. The 45 to 54 group, which led February’s demographic surge, held its position at 19% with 36.67% growth.
Together, these two cohorts represent the fastest-moving edge of Australia’s entrepreneurial market right now. They bring something that younger founders typically cannot: deep domain expertise, established professional networks, and the financial standing to fund operations from day one rather than bootstrap cautiously. When experienced operators enter a market, they tend to do so with speed and conviction.
The 25 to 29 bracket also grew strongly at 27.37%, suggesting the market is not simply skewing older – younger founders remain active. But the dominant growth energy in March belongs to the experienced end of the age spectrum, and that has implications for how new competitive entrants in virtually every industry sector should be understood and anticipated.
Countries of Birth
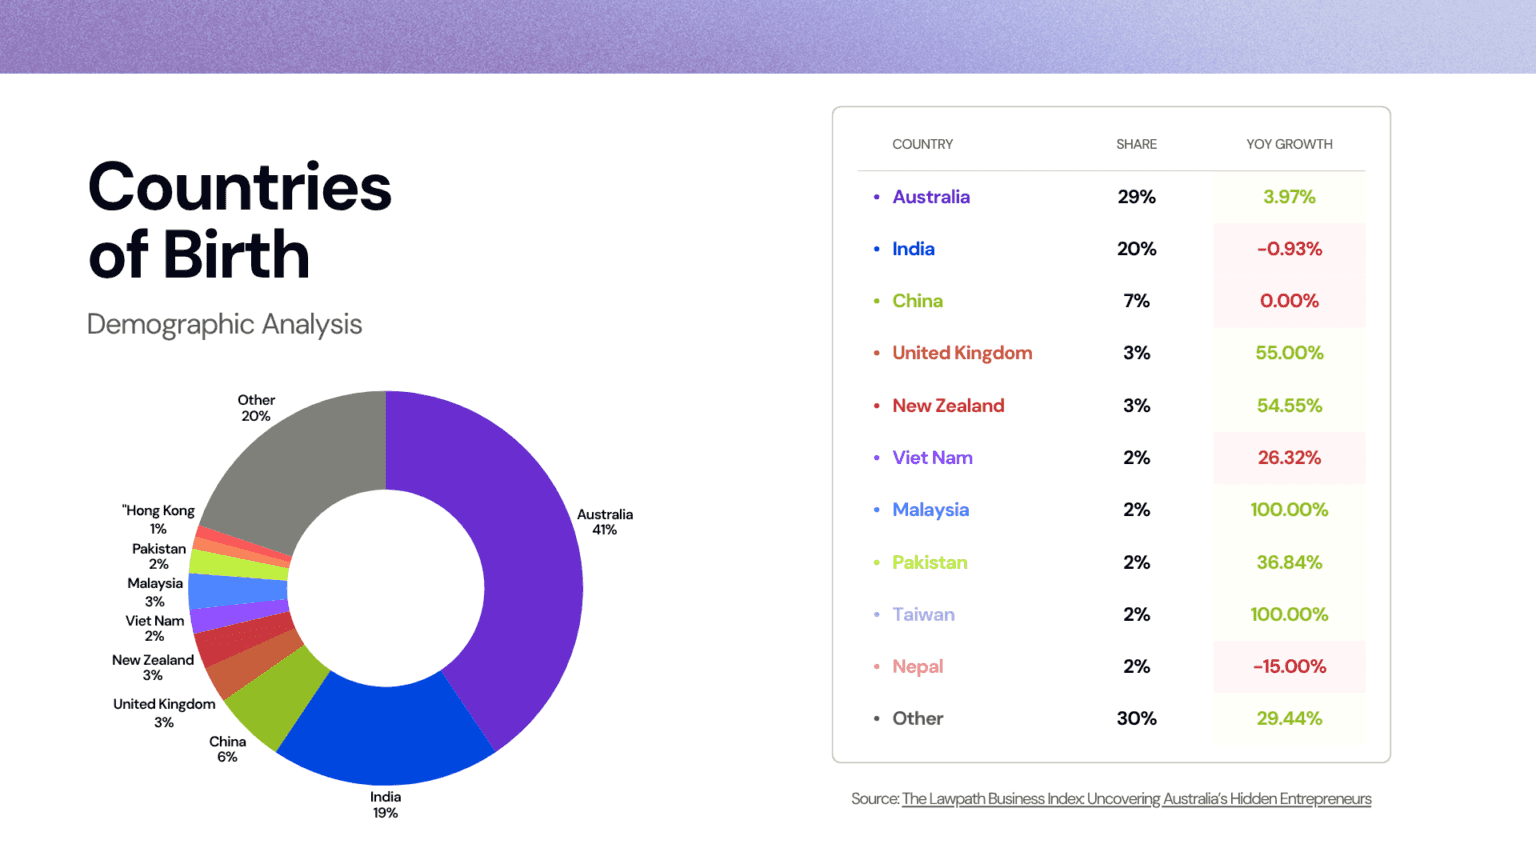
March’s platform data shows that 41% of founders registered through Lawpath were born in Australia, with India at 20%, China at 7%, and the United Kingdom, New Zealand, Malaysia, and Vietnam each contributing meaningfully to the remainder.
The standout growth figures belong to founders from the United Kingdom at 55% year-on-year growth and New Zealand at 54.55%. Malaysia and Taiwan both doubled year on year from their respective bases. These are not small movements at the margin. They reflect a widening of the international contribution to Australian business formation – not just the continuation of established migration patterns, but the emergence of newer cohorts entering the market with clear commercial intent.
The diversity of March’s founder base is both a competitive fact and a market signal. The businesses these founders are building are shaped by international experience and designed to serve communities and consumer behaviours that are among the most dynamic and fastest-changing in Australia.
Industry Distribution
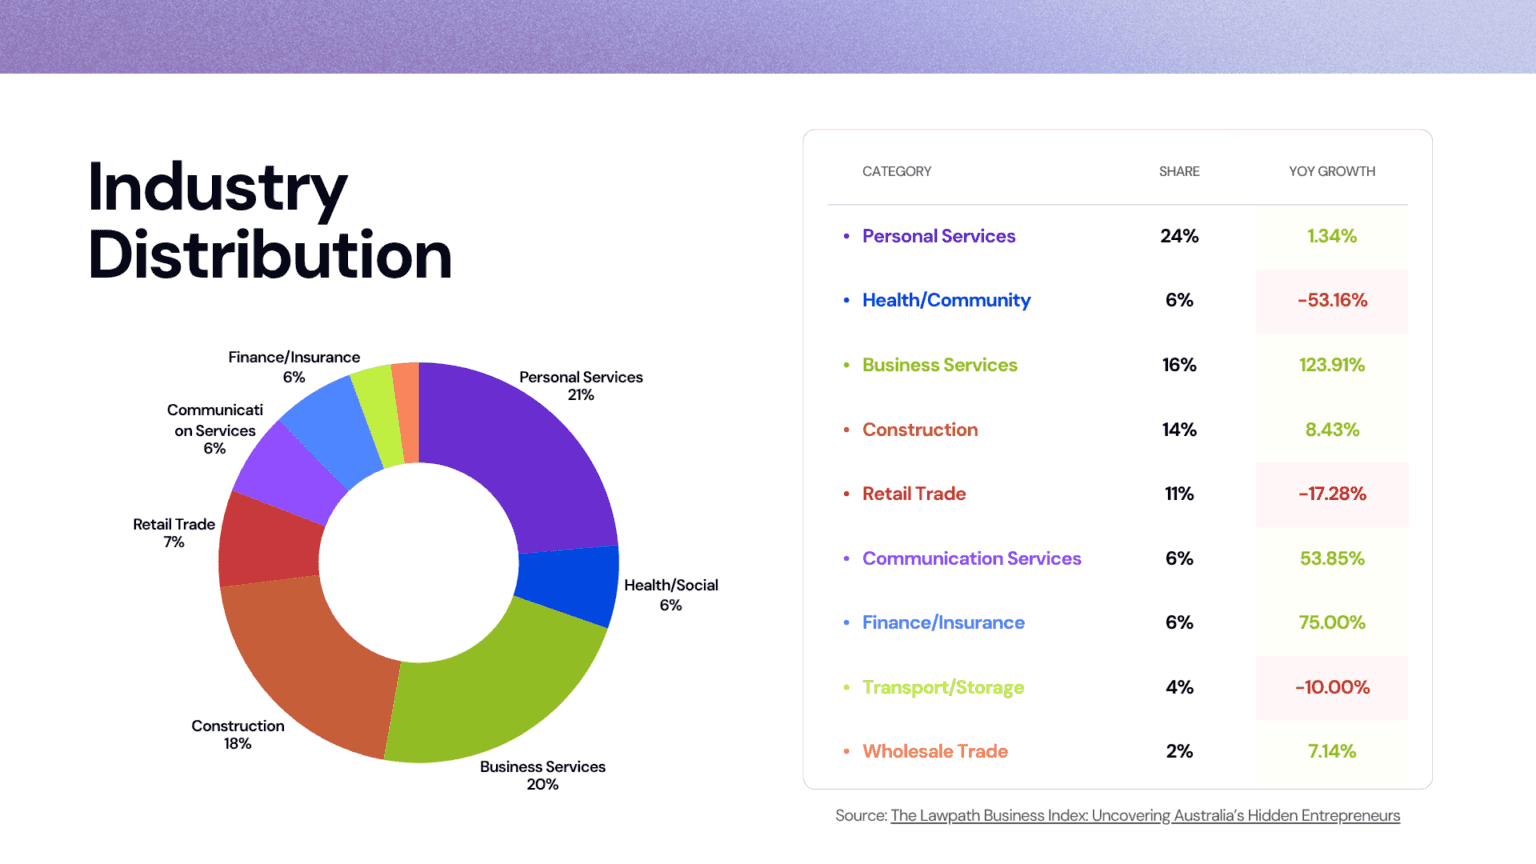
The industry story of March belongs to Business Services. At 16% of all new registrations and a 123.91% year-on-year growth rate, it is the fastest-expanding sector in the index by a wide margin – a rate of growth that has no recent comparison in this data set. Whether driven by the formalisation of consulting and advisory work that was previously operating informally, a surge in demand for support services as the broader business market expands, or the natural consequence of so many experienced mid-career founders entering the market at once, the scale of this expansion will reshape competitive density in the sector.
Personal Services held its position as the largest sector by share at 21% of registrations, with growth moderating to 1.34% year on year after February’s exceptional 67% surge. That normalisation was expected, and the underlying demand driving Personal Services formation remains intact.
Communication Services grew at 53.85% and Finance/Insurance at 75%, continuing the pattern of service-sector businesses outpacing goods-based formation. Construction remained steady at 8.43% year-on-year growth, its third consecutive month of consistent activity. Retail Trade declined 17.28% and Transport/Storage fell 10%, reflecting ongoing structural pressure on volume-driven, asset-heavy business models in a market that is increasingly favouring lean, service-oriented structures.
The shape of Australia’s new business formation in March is service-led, knowledge-intensive, and structured for scale. That is a different competitive landscape than the one that existed 12 months ago.
Why this matters for business owners
March 2026 provides the clearest answer yet to the question the first quarter has been building toward: is the elevated formation activity of 2026 a feature of this market, or a temporary condition?
124,516 new businesses. 10.34% year-on-year ABN growth. 17.02% ACN growth. GST registrations near flat for the second consecutive month. Placed alongside January and February’s equally elevated results, these numbers describe a market that is not running down. It is running deeper.
The character of what is entering the market matters as much as the volume. Founders aged 55 and over are growing faster than any other cohort. Business Services posted the strongest industry growth rate in recent index history. Queensland emerged as the fastest-growing major state. And company formations have outpaced general ABN growth for three months in a row.
The new competitive activity entering Australian markets in 2026 is experienced, formally structured, geographically distributed, and concentrated in sectors that are not slowing down. For existing businesses, the strategic question is not whether this activity is happening. It is whether you understand who is entering your market, where they are coming from, and how they are likely to compete.
The Lawpath Business Index will continue tracking these developments each month, providing the clearest available view of how Australian business is evolving in real time.